 Tarogato, on 29 September 2015 - 10:22 PM, said:
Although many did, not everybody gave me their exact number of wins and losses each. I was indeed planning on going back and grabbing that information later, though. Will probably be a few days before I get around to it, though - if I do at all.
No need to go back, you have the numbers in your excel file, just need to calculate it from the W/L ratio and total matches.

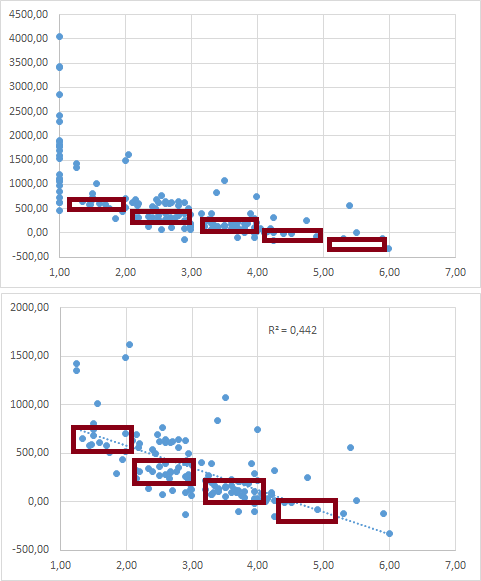
Best correlation so far I think. Since it's an absolute number I removed the guys that have saturated their rating at 1.0 from the line fit. In order to improve the fit I think you'd need access to everyones average score per match... perhaps KDR could be factored in as a substitute for that.
Excess wins plotted versus "exact" tier. (excess wins = nr of wins - nr of losses)

All in all, very interesting read! Thanks for putting in the work and for sharing the raw data!!
The outliers in this plot would be people who either plays with a good group and wins a lot, but contributes really poorly themselves, or the reverse, people who plays with small/horrible group and lose a lot but carries like a champ.
Edit: Interesting fun fact here if you decide to trust this graph is that you can put your own nr of excess wins and your current tier and read out if you are ahead of your surrounding average in your progression (below the dotted line) or if you are generally pulling your team down (above the dotted line).
Edited by Duke Nedo, 30 September 2015 - 02:26 AM.
 Tarogato, on 29 September 2015 - 11:22 PM, said:


