Jump to content

The Curious Case Of The Broken Matchmaker: Bads, Terribads, Chronicbads And Pugstarheroes


152 replies to this topic

#1 Mister Blastman

    Member

  • PipPipPipPipPipPipPipPipPipPip
  • Survivor
  • Survivor
  • 8,444 posts
  • LocationIn my Mech (Atlanta, GA)

Posted 09 July 2016 - 07:37 AM

I expect this to be a polarizing thread. But I hope it can prove to be a useful one and ultimately one other folks are willing to share and contribute too.

This is a thread built on data and statistics, not blind accusations.

This is a thread built on concrete numbers provided to us by the leaderboards.

Premise:
There was a time many moons ago where we had to accept the results given to us by the great matchmaker overlords. Often there would be 12-0, 12-1 and 12-2 stomps and often folks would chalk it up as bad luck or whatever. Sometimes accusations would be thrown around, things such as, "I got a team full of terribads," or "The matchmaker stacked me with awful players and put nothing but average players on the other team!" or, "Screw you all, I just lost 20 games in a row and I'm uninstalling!"

Whatever the case was, the variety was immense. But there was speculation. There was speculation as to what was really happening.

The big question being... Was the matchmaker really fair? Was it doing its job? Was there a reason beyond "Brantlebot got stuck on a rock and stubbed his toe as a Myst Lynx explored a new side of himself on said stuck Brantlebot, up close and personal..."

At the time we did not know. We had no idea what was going on. We could only assume.

But the leaderboards have given us opportunity! Now we can truly know if the team we were put on was fair--and if the odds were stacked against us from the start!

Goal:
Share bad games you've had plus data you collect.

Format:
Screenshot with names blanked out
Four columns of data collected from the leaderboards:
a. Match Score
b. KDR
c. Win/Loss Ratio
d. Games played

Plus an average beneath.

For the sake of understanding, I will provide examples at the bottom of this thread.

In one brief anecdotal observation from a game I picked at random, I have coined a new phrase. I call it"chronicbad."

We've heard the expression "terribad" passed around on the forums, and I've often used the word "terriscared," to describe those players in games that cost a team the win due to hiding.

The name should be self explanatory.

I have great interest in this data as I PUG only these days due to time constraints and all the hours I work and write. I want to be able to click "play" and get fair games, every time. I think PGI is not doing enough in regards to making these games fair. But they need data! They need facts to back our case up!

And we need to make a case to them in a logical, substantiative manner from a new angle (one we must figure out) so it makes sense.

The matchmaker CAN be better!

So, here's the first example:
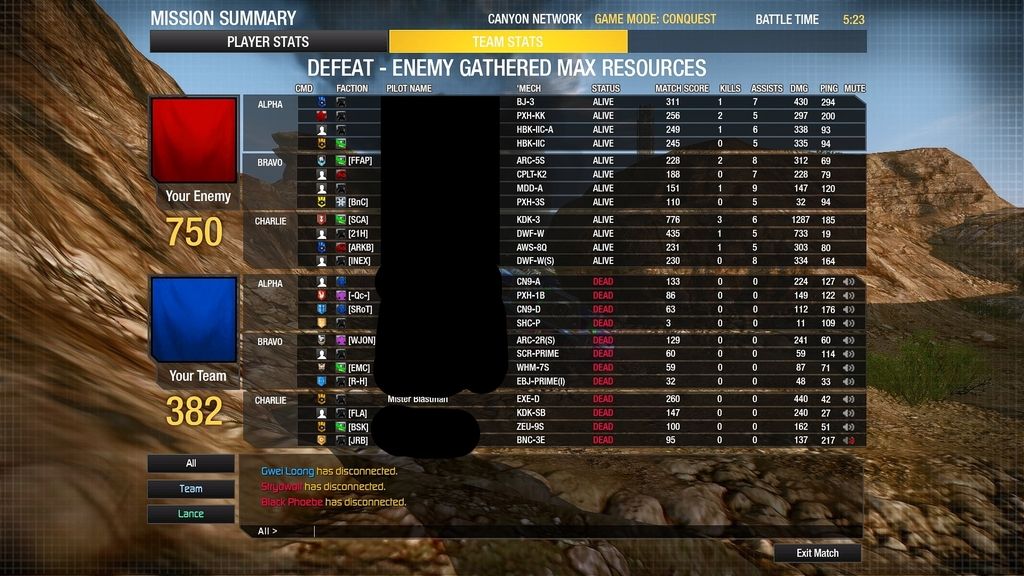
Posted Image

And the stats:

Bad team
MS KDR W/L Games
202 .65 .79 422
212 1.03 .72 50
200 .75 1.05 174
184 .62 .75 515
200 .97 .93 492
186 .89 .92 75
240 1.35 1.03 79
239 1.27 .78 91
343 3.22 1.59 171
213 1.12 1.06 337
219 .84 1.07 141
195 .68 .80 652

228 1.12 0.96 266.6 (3199) AVERAGES

Good Team
MS KDR W/L Games
298 2.00 1.35 169
179 .76 1.08 306
217 2.31 1.20 88
262 1.21 .97 136
266 2.14 1.16 147
241 2.07 1.32 109
245 1.55 1.29 250
143 .33 1.13 279
417 3.72 2.76 97
267 1.09 1.27 145
205 .92 1.04 191
197 .73 1.08 331

245 1.57 1.3 187.33 (2248) AVERAGES


Let's break down the data above...

Winning team had an average match score of 245
Losing team had an average match score of 228

Per PGI, that's only a 17 point difference. This works out to be a difference of 7.5%. Per their words in the past, "not a big deal."

OH, BUT IT IS A BIG DEAL, PGI!

The average KDR was 1.57 versus 1.12
The average Win/Loss ratio was 1.3 versus 0.96

Let that sink in. The players on the winning team on average win 35.4% MORE GAMES than the losers.

That means they have a 35.4% higher chance of winning, every single time.

The KDR illustrates a 40% differential. 40% more likely to kill something BEFORE THEY DIE.

Wow.

Now, back to one of my first remarks, way up top. I used the term "chronicbad." What is a chronicbad?

Well...

In the game above the losing team had 3199 games under their belts versus the winning team's 2248 games.

The losing team had way more experience! But they lost! And their statistics illustrate they lose far more often and do far worse!

This... is the classical case of chronicbad.

What does this mean?

It means some players are chronically terrible at the game and no matter how much they play, they're just... bad. Chronicbad players should not be stacked together on the same team versus players who have on average far superior statistics. By stacking chronicbads together on a single team (and maybe throwing one or two players on that same team with decent statistics) versus good players or even average players, you SET SAIL FOR FAIL!

There is no excuse for this. This should NOT happen. But... that's just ONE GAME. I don't know how often this happens... yet.

And we need your help!

Let's help PGI find a better way to arrange the games.

WHY?

Better Games for EVERYONE.

The chronically bad players do not like being clubbed like seals. The good players do not like clubbing seals, either! Everyone is more likely to be happier when the games are close knucklebiters.

So the goal is to let the chronically bad players play with the chronically bad giving them a chance to eventually rise from their pool and jump into the pool with everyone else--and to let them do so in an environment that fosters enjoyment of the game and a reason for them to keep playing.

You know those threads that people love to complain in? The ones where they say stuff like, "I just lost 20 games in a row and this sucks! I'm out!"

That's a problem. And the solution can be found through matchmaker data.

Fixing the matchmaker means HAPPIER players and MORE REVENUE for the game!

So please, consider contributing to this thread so we can make sense as to what is going on.

Thanks!

Edited by Mister Blastman, 09 July 2016 - 07:38 AM.


#2 Chrithu

    Member

  • PipPipPipPipPipPipPipPip
  • Bad Company
  • 1,601 posts
  • LocationGermany

Posted 09 July 2016 - 07:47 AM

I like the idea. Will see if I have time to submit matches from time to time.

#3 Jackal Noble

    Member

  • PipPipPipPipPipPipPipPipPip
  • 4,863 posts
  • LocationTerra

Posted 09 July 2016 - 07:54 AM

Sometimes you just lose. Will look into this, tho it's quite an undertaking for the collated data to actually have any relevance across the board. That and psr, tho highly criticized, would add one more aspect of it were available. Many other games provide waay more stats available to the user base. Why PIG doesn't make interesting stats like these available to its stat hungry players is beyond me really. Great post blastman

Edited by JackalBeast, 09 July 2016 - 07:55 AM.


#4 Hit the Deck

    Member

  • PipPipPipPipPipPipPipPipPip
  • 4,677 posts
  • LocationIndonesia

Posted 09 July 2016 - 07:58 AM

It's definitely interesting but I don't understand how the Leaderboard works. Since when has it begun to record your performance?

#5 Navid A1

    Member

  • PipPipPipPipPipPipPipPipPip
  • CS 2022 Gold Champ
  • CS 2022 Gold Champ
  • 4,954 posts

Posted 09 July 2016 - 07:58 AM

I see you've got an idea...
Does PGI knows about this?

#6 Mister Blastman

    Member

  • PipPipPipPipPipPipPipPipPipPip
  • Survivor
  • Survivor
  • 8,444 posts
  • LocationIn my Mech (Atlanta, GA)

Posted 09 July 2016 - 08:02 AM

View PostHit the Deck, on 09 July 2016 - 07:58 AM, said:

It's definitely interesting but I don't understand how the Leaderboard works. Since when has it begun to record your performance?


It started recording games as of the June 21st patch. So any game you've played in the PUG Solo Queue or the Group Queue since them are counted and tabulated as part of the score.

Unfortunately the Group Queue numbers can really screw things up as you'll find folks with 3 or 4+ :1 win/loss ratios and it is practically impossible to win like that in the solo queue unless you're running something like a KDK-3 with UAC/10 (and some folks have demonstrated how great this robot is with brutal and astonishing results). But that's not the point of this thread. The point of it is science! :)

#7 Hit the Deck

    Member

  • PipPipPipPipPipPipPipPipPip
  • 4,677 posts
  • LocationIndonesia

Posted 09 July 2016 - 08:08 AM

View PostMister Blastman, on 09 July 2016 - 08:02 AM, said:

It started recording games as of the June 21st patch. So any game you've played in the PUG Solo Queue or the Group Queue since them are counted and tabulated as part of the score.

Ah that's why I have terribad score from playing Scouting in the last two weeks Posted Image

#8 Mister Blastman

    Member

  • PipPipPipPipPipPipPipPipPipPip
  • Survivor
  • Survivor
  • 8,444 posts
  • LocationIn my Mech (Atlanta, GA)

Posted 09 July 2016 - 08:34 AM

View PostNavid A1, on 09 July 2016 - 07:58 AM, said:

I see you've got an idea...
Does PGI knows about this?


Not yet. :)

With evidence, maybe we can make it known to them!

#9 Malcolm Vordermark

    Member

  • PipPipPipPipPipPipPipPipPip
  • 2,520 posts

Posted 09 July 2016 - 08:36 AM

I think some of the conclusions you've drawn from the data are off, but I think you've understated the difference. Since the more successful players are likely in a higher tier they are likely more successful against stronger opposition.

At any rate, I think this is a very interesting idea. I look toward to seeing how it turns out.

#10 TheVent

    Member

  • PipPip
  • The Serpent
  • The Serpent
  • 49 posts

Posted 09 July 2016 - 08:37 AM

This has got to be without a single doubt the best, most relevant, and well put together forum post I have ever seen. Nicely done Mister Blastman. I'm in full agreement with you and it was a feat for you to not only come up with all this but also to compile it and create an example. If I have any games that warrant a "What the **** just happened there?" I'll be sure to screenshot some info and crunch some numbers. Thank you for being part of the solution instead of choosing to ***** about game mechanics or PGI's supposed lack of shits to give.

#11 LT. HARDCASE

    Member

  • PipPipPipPipPipPipPipPipPip
  • The Spear
  • The Spear
  • 2,706 posts
  • LocationDark Space

Posted 09 July 2016 - 08:49 AM

Nice Gunstar Heroes reference. I see you.

#12 wanderer

    Member

  • PipPipPipPipPipPipPipPipPipPipPip
  • Civil Servant
  • Civil Servant
  • 11,152 posts
  • LocationStomping around in a giant robot, of course.

Posted 09 July 2016 - 08:58 AM

You can refine that data further by pulling data-by-weight-class for the pilots in question, just to mention. A player who happens to be great in lights but decided to slum in a heavy he can barely shoot with has better overall stats, but the weight-specific data will tell a more truthful story when he goes full potato in his new C-bill Archer.

#13 Mister Blastman

    Member

  • PipPipPipPipPipPipPipPipPipPip
  • Survivor
  • Survivor
  • 8,444 posts
  • LocationIn my Mech (Atlanta, GA)

Posted 09 July 2016 - 09:53 AM

View Postwanderer, on 09 July 2016 - 08:58 AM, said:

You can refine that data further by pulling data-by-weight-class for the pilots in question, just to mention. A player who happens to be great in lights but decided to slum in a heavy he can barely shoot with has better overall stats, but the weight-specific data will tell a more truthful story when he goes full potato in his new C-bill Archer.


Not a bad idea!

#14 Yellonet

    Member

  • PipPipPipPipPipPipPipPip
  • Ace Of Spades
  • Ace Of Spades
  • 1,956 posts
  • LocationSweden

Posted 09 July 2016 - 11:16 AM

I'm all for this as I've thought about starting to collect data myself.

But, have I understood it correctly if for every match I need to take a screenshot, mask out the names, then look up 4 values on the leaderboard for each of the 24 players?

#15 wanderer

    Member

  • PipPipPipPipPipPipPipPipPipPipPip
  • Civil Servant
  • Civil Servant
  • 11,152 posts
  • LocationStomping around in a giant robot, of course.

Posted 09 July 2016 - 11:18 AM

View PostYellonet, on 09 July 2016 - 11:16 AM, said:

I'm all for this as I've thought about starting to collect data myself.

But, have I understood it correctly if for every match I need to take a screenshot, mask out the names, then look up 4 values on the leaderboard for each of the 24 players?


That's not hard, considering you can search the leaderboard by player name. Even average match score can give you a good start, although frankly I don't blank out names on screenshots anyway, as it doesn't violate "name and shame".

#16 nitra

    Member

  • PipPipPipPipPipPipPipPip
  • Philanthropist
  • 1,656 posts

Posted 09 July 2016 - 11:34 AM

So... to summarize, it is the teams fault ?

I knew it !!!


seriously though good info , i dont know why pgis algorithm would lump these players like this together.

off top my head i would guess maybe they have a higher churn and end up getting placed in a que quicker than the better players . resulting in the lopsided results.

#17 Yellonet

    Member

  • PipPipPipPipPipPipPipPip
  • Ace Of Spades
  • Ace Of Spades
  • 1,956 posts
  • LocationSweden

Posted 09 July 2016 - 12:07 PM

View Postwanderer, on 09 July 2016 - 11:18 AM, said:


That's not hard, considering you can search the leaderboard by player name. Even average match score can give you a good start, although frankly I don't blank out names on screenshots anyway, as it doesn't violate "name and shame".

No, it's not hard, but it sure takes a while...

Posted Image

Winners
Matchscore KDR W/L Games
273 1.31 1.3 53
206 1.08 0.76 151
204 0.91 0.97 128
148 0.41 1.27 125
203 0.98 1.23 89
216 1.19 1.18 24
157 0.47 0.87 257
159 0.57 0.55 79
268 1.11 0.99 275
218 0.92 1 108
230 1.22 1.04 514
180 0.67 0.91 84
Averages 205.17 0.90 1.01 157.25


Losers
Matchscore KDR W/L Games
224 1.34 1.18 436
177 0.71 0.81 165
161 0.66 0.88 63
242 1.64 1.14 212
176 0.68 0.89 172
227 0.74 1.18 282
240 1.38 1.4 12
195 0.83 1.1 181
263 1.34 1.2 188
201 0.97 1.25 90
188 0.96 1 32
234 1.02 1.36 200
Averages 210.67 1.02 1.12 169.42

Edited by Yellonet, 09 July 2016 - 12:08 PM.


#18 Sagamore

    Member

  • PipPipPipPipPipPipPip
  • The Blood Bound
  • The Blood Bound
  • 930 posts
  • LocationCanada

Posted 09 July 2016 - 12:33 PM

Nice data collection. Very interesting.

I guess the problem is the current match maker only cares about your Tier which is determined largely by wins/losses excluding other stats (high match score can advance tier faster but everyone theoretically maxes out at Tier 1).

Things like KDR are hard to use for balancing games because it could lead to selfish play. Winning/Losing is ultimately what matters in a team game.

But even that statistic: My win% sucks at the moment if you go by leaderboard stats (0.88) since I've been leveling new mechs pretty much exclusively since it started. My overall win % is 1.32. So I don't know if any of these statistics can be taken at face value until everyone has a requisite number of games under their belt. Or maybe I'm a terribad and don't know it.

Edit: Removed giant quote

Edited by Sagamore, 09 July 2016 - 12:45 PM.


#19 Deathlike

    Member

  • PipPipPipPipPipPipPipPipPipPipPipPipPipPip
  • Littlest Helper
  • Littlest Helper
  • 29,240 posts
  • Location#NOToTaterBalance #BadBalanceOverlordIsBad

Posted 09 July 2016 - 12:44 PM

The MM considers your internal PSR score (relative to Tier), and tries to use that as an average.

The problem is that if you are a super grindy "tryhard", you'll reach Tier 1, but it's not meaningful in the full scope of things. I'm Tier 1, but I'm just a slightly above average scrub. Compare that to EmP/SJR where their Tier 1 status is far more meaningful... yet I'm lumped in with that, possibly screwing them over, or screwing myself over.

Averages only mean something if the values are properly weighed.

Edited by Deathlike, 09 July 2016 - 12:45 PM.


#20 Yellonet

    Member

  • PipPipPipPipPipPipPipPip
  • Ace Of Spades
  • Ace Of Spades
  • 1,956 posts
  • LocationSweden

Posted 09 July 2016 - 12:47 PM

Posted Image


Winners
Matchscore KDR W/L Games
234 2 1.1 103
246 1.32 0.69 61
199 1.18 1.05 238
169 0.5 1 114
225 0.93 1.1 147
264 2.3 2.5 21
203 0.86 0.66 101
167 0.7 0.77 369
255 1.19 1.04 114
317 3.95 1.53 228
165 0.45 1.01 431
211 1.05 1.39 135
Averages 221.25 1.37 1.15 171.83


Losers
Matchscore KDR W/L Games
224 1.34 1.17 437
241 0.96 0.76 72
207 1.18 1.33 164
178 0.69 0.94 1043
255 0.95 1.36 170
279 1.38 1.1 65
182 0.8 0.9 171
148 0.71 1.88 23
198 0.95 1.38 190
208 1.2 1.09 242
167 0.99 0.96 239
176 0.76 1 169
Averages 205.25 0.99 1.16 248.75


1 user(s) are reading this topic

0 members, 1 guests, 0 anonymous users